WEEKLY | April 13, 2026 | Macro Insights Queen
Hi everyone — this week’s edition follows a similar structure to the web version, but I want to be more direct about what actually matters.
The ceasefire headlines may have eased immediate panic, but the underlying macro regime has not changed.
📌 What mattered this past week:
- The ceasefire already looks fragile.
- The oil shock is still very much in place.
- U.S. data surprised to the upside, but underlying “real” activity still looks softer beneath the surface.
- March ISM Manufacturing strength was largely driven by Aerospace and Semiconductors, suggesting growth is becoming increasingly policy-led rather than broad-based.
- Headline inflation is already starting to feel the impact of higher energy prices.
- Lower P/E multiples had already partially priced in the Iran conflict, so last week’s dip-buying on de-escalation makes sense. But that rebound also relies on optimistic earnings expectations — even for more vulnerable sectors like staples and consumer discretionary.
So the core question remains unchanged:
Can policy-driven growth offset softer consumer demand if the oil shock persists?
That is still the key macro question driving markets
⚠️ Ceasefire headlines don’t mean the shock is over.
Over the past week, the market has treated the ceasefire as a green light to fade oil risk. The S&P 500 is now around 2.4% below its all-time high.
But we think that is too optimistic and simplistic.
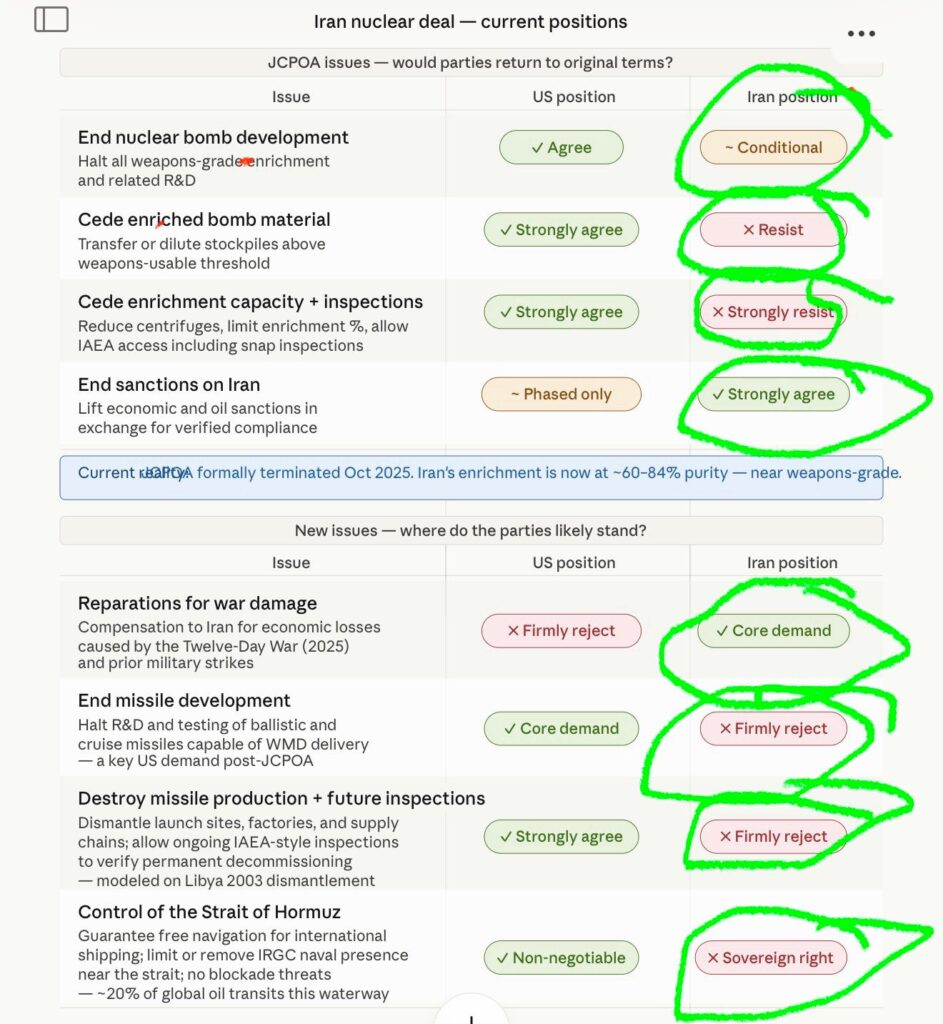
The U.S. and Iran are still far apart on what a durable settlement would actually look like (see chart shared by Andy Constan above).
That matters because even if the fighting temporarily slows, it does not automatically mean energy markets will return to normal.
The latest negotiations in Islamabad also ended without a deal, with Vance leaving empty-handed.
In any case, the issue was never just, “Will Hormuz fully close?”
The real issue is whether:
- shipping remains disrupted,
- flows become more selective,
- supply uncertainty persists.
Even partial frictions can keep energy prices elevated.
Our first conclusion remains unchanged:
The oil shock regime is still intact.
Yes, ceasefire headlines can create short-term downside in crude.
But structurally, oil still looks likely to remain elevated for longer than markets are currently pricing.
📈 Growth looks okay on the surface — but softer underneath.
Last week’s U.S. data surprised positively:
* Retail Sales: +0.6% m/m (vs +0.5% expected)
* ISM Manufacturing PMI: 52.7 (vs 52.3 expected)
* NFP:+178k (vs +65k expected)
At first glance, this looks resilient.
But the nuance matters.
Consumer demand is not as strong as the headline suggests.
ISM services fell to 54 in March from 56 the previous implying a softening demand
Retail sales look decent in nominal terms.
But once you adjust for inflation, real consumption has been softening in trend (see chart by @irvingshivser)
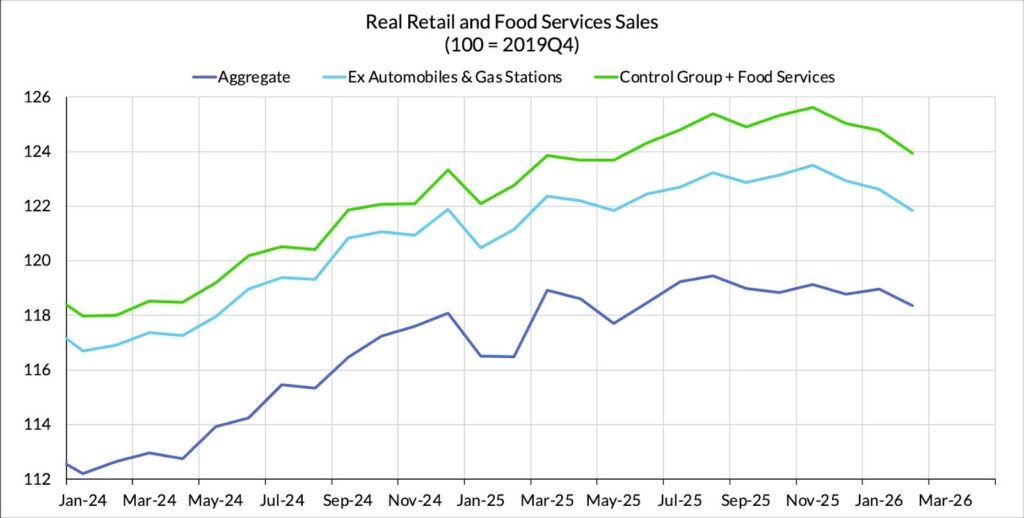
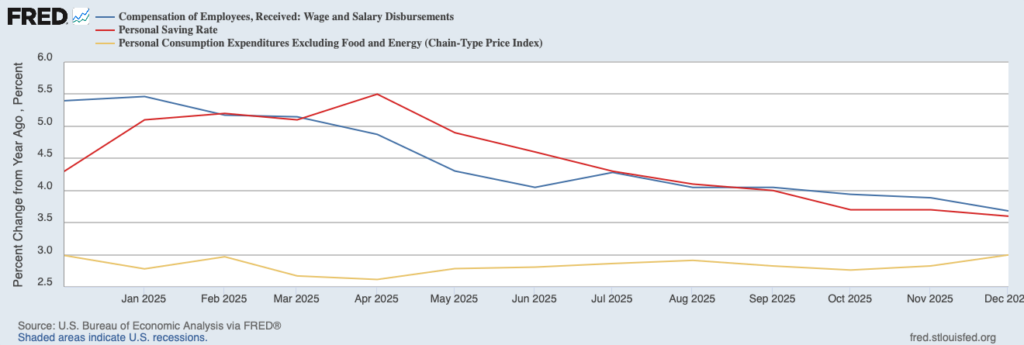
This fits what we discussed last week:
Consumption has increasingly been supported by **dissaving**, not stronger wage growth.
That matters because dissaving can support activity for a while as long as rates stay low or lower, but it is not a sustainable engine for growth.
🏭 Manufacturing is being supported by a few key sectors.
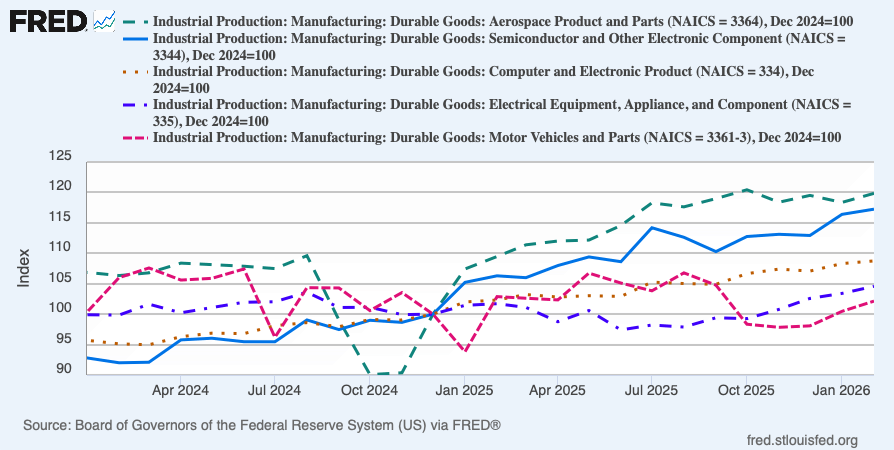
The March PMI headline looks stronger, but the composition matters (see chart above).
The main support is coming from:
- aerospace / defense
- semiconductors / AI capex
These are sectors directly supported by the supply side, i.e. they are policy-driven. The increase in defense spending globally, along with the government’s focus on AI, is driving the outperformance of these sectors.
Meanwhile:
- Consumer demand-sensitive sectors, such as motor vehicles, have been slowing. As a result, broader cyclical sectors remain soft.
- Manufacturing labor is still contracting at 48.7.
- March manufacturing prices increased to 79 from 70 previously.
MIQ takeaway:
Growth is holding up, but it is becoming increasingly narrow.
This is not broad-based private demand strength.
🛢️ Inflation is already responding to the oil shock.
As we discussed in the previous edition, whether an oil shock becomes inflationary or disinflationary depends on the economy’s prior growth condition.
So far, the latest CPI confirms that the energy pass-through has already started.
Key CPI:
- Headline CPI: +0.9% m/m
- Headline CPI: +3.3% y/y (vs 2.4% prior)
- Core CPI: +0.2% m/m
- Core CPI: +2.6% y/y
What this tells us:
- energy is lifting headline inflation,
- core remains relatively contained,
This is typically how these shocks unfold:
- headline inflation rises first,
- real demand softens later,
- broader growth slows with a lag.
🔎 Big picture: growth is holding up, but it is getting narrower.
This is still the key macro issue.
The latest data shows that headline growth is holding up better than expected. But underneath, consumption is softening while growth is increasingly being supported by the supply / policy side of the economy.
As we discussed last week:
- dissaving has been supporting consumption,
- wage and income growth have slowed.
That matters because:
- softer consumption helps disinflation over time,
- but it is also a clear headwind for growth especially when there is an energy shock + tightening monetary conditions.
What is still supporting growth?
Right now, resilience is increasingly concentrated in:
- AI capex,
- semiconductors,
- aerospace / defense,
- Fiscal / industrial policy support e.g. increases defense spending all over the world that impacts aerospace sector in the US.
These sectors can support activity for a while.
Key questions:
- Can policy-driven growth offset softer consumption if the oil shock persists?
We think it is too simplistic to assume that AI and defense can fully offset the shock without hurting the rest of the economy.
Most vulnerable areas remain:
- consumer discretionary,
- transport,
- staples.
Housing and real estate may also face pressure if elevated oil keeps rates higher for longer or further squeezes household purchasing power.
- Is it enough for equities to stay bullish simply because AI earnings projections remain elevated?
If the oil shock persists and spills over into LNG and natural gas prices, can even tech earnings remain insulated?
Higher energy costs could still:
- pressure margins,
- raise data centre operating costs,
- challenge capex assumptions.
The real issue is how long earnings expectations can stay elevated before weaker demand and higher energy costs force a repricing.
👀 Cross-asset view: this is where the divergence matters.
🛢️ Oil: still the anchor
Oil is still the most important macro variable right now.
Why?
Because sustained higher oil:
* keeps headline inflation sticky,
* squeezes consumers,
* pressures margins,
* tightens financial conditions indirectly.
The market is trying to price a quick normalization.
I think that is premature.
As long as supply remains uncertain, oil still matters.
📈 Equities: relief rally makes sense, but the bigger question remains
The relief rally makes sense in the short term, especially since lower P/E multiples had already partially priced in the conflict.
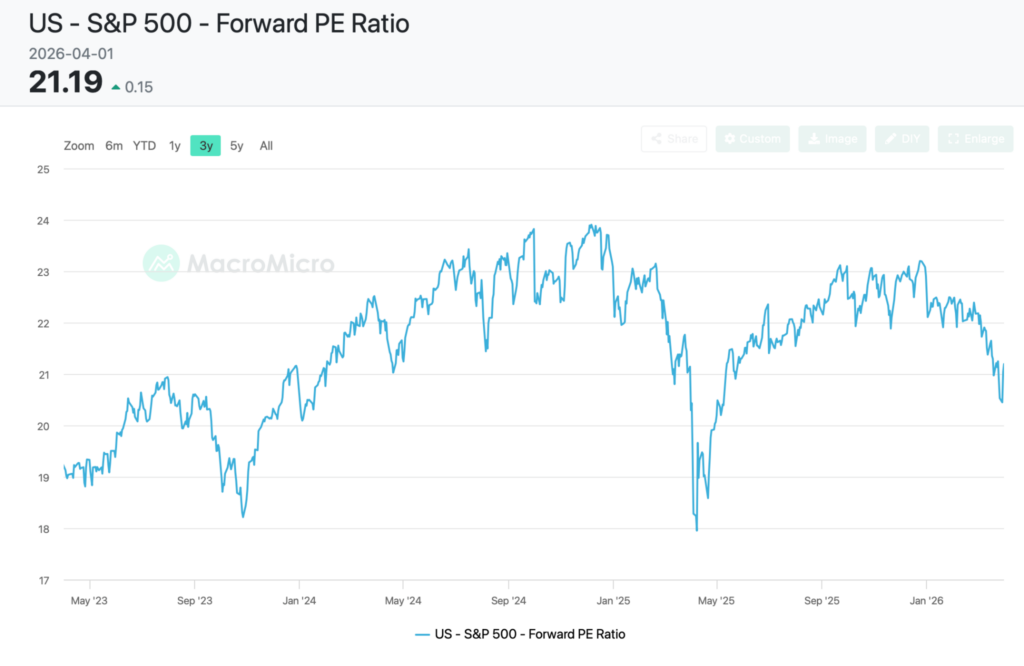
That has supported dip-buying.
But the bigger issue is forward earnings. We have a higher high projection of EPS for 2026 and 2027.
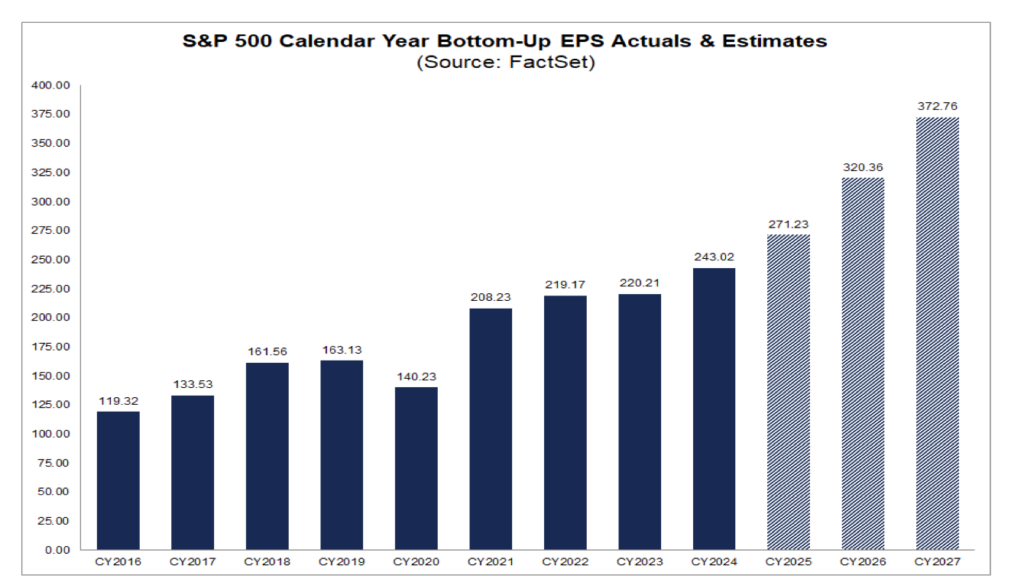
Markets are still assuming that:
- earnings remain resilient this year,
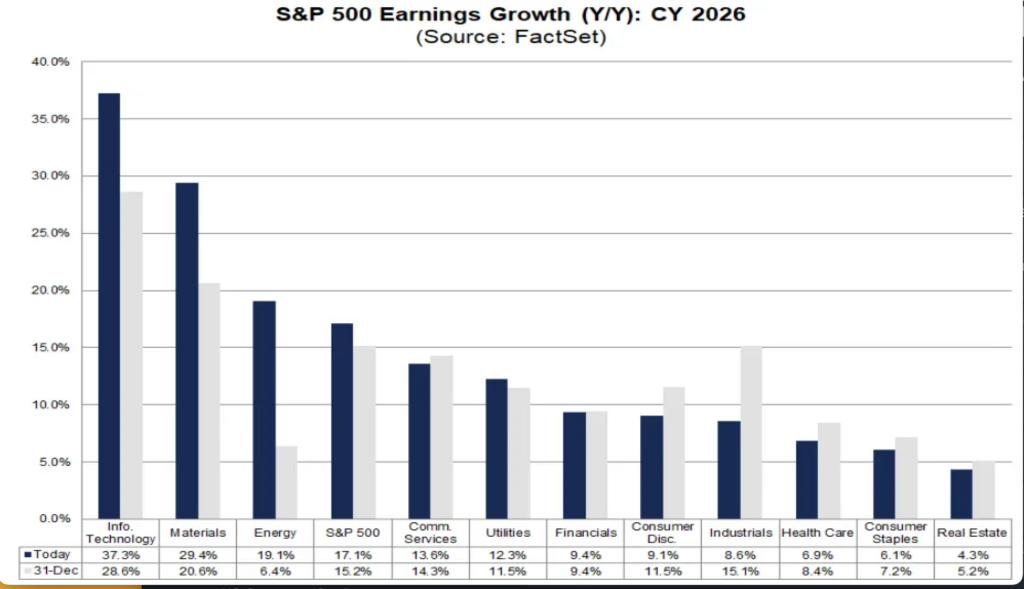
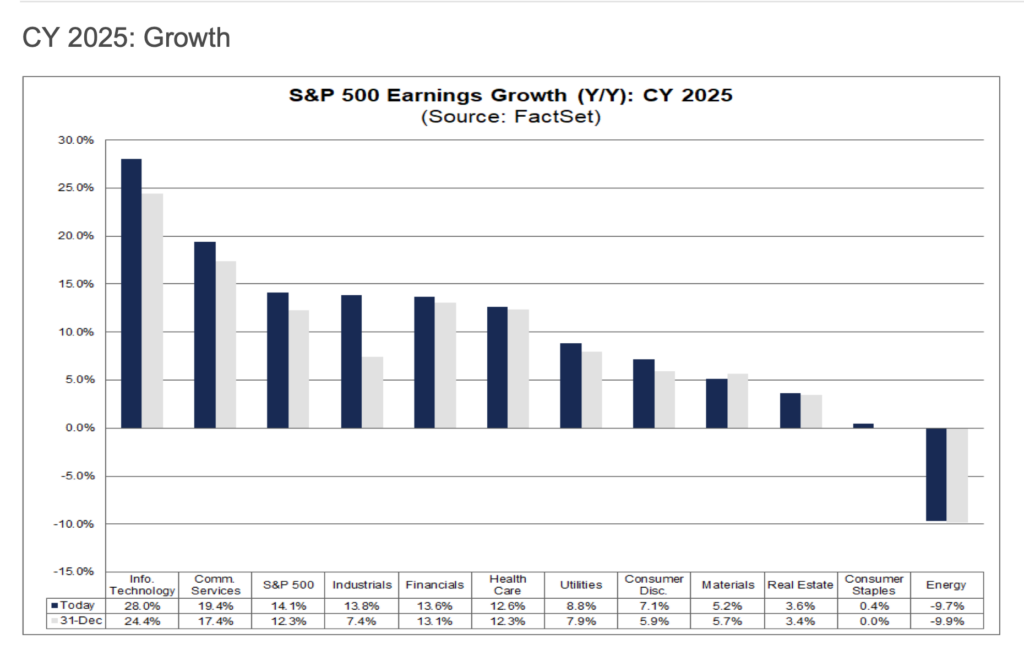
- 2026 earnings stay stronger than 2025 (see charts),
- The assumption is AI driven growth can offset broader weakness.
That may prove too optimistic if oil stays elevated and demand weakens.
This brings us to the bigger question we raised earlier: can equities continue to rally on the back of AI-driven earnings expectations while largely looking through the energy shock?
Right now, the impact of higher energy costs on more vulnerable sectors still does not appear to be fully reflected in earnings projections (see charts above).
And if so, how long can this rally last before weaker demand and margin pressure force earnings expectations lower across more parts of the market?
💵 USD / EURUSD
Pre-war, the market was heavily short USD.
The conflict initially supported the dollar because:
- higher oil tends to support USD,
- geopolitical stress typically drives safe-haven flows.
That said, there is also a debate that part of the recent USD strength has been driven more by forced positioning and short covering rather than a genuine safe-haven bid linked to the oil shock.
The Middle East conflict has also raised some doubts among market participants about the USD’s status as a safe-haven asset. However, the current global financial system remains heavily dependent on the dollar.
Then, ceasefire headlines triggered a sharp EUR rebound last week.
At the moment, there are two possible outcomes for EURUSD:
Short EURUSD case:
- oil stays elevated,
- conflict drags on,
- the Eurozone remains more exposed to energy costs.
- The current technical could trigger a bullish EURUSD if it hits above 1.177-1.18 area.
Bullish EUR case:
- genuine de-escalation,
- lower energy stress,
- the ECB remains relatively hawkish.
- We would want EURUSD to move back below 1.165, with a decisive break below 1.16, to confirm a sustained short setup.
Currently, the market is pricing in one to two ECB cuts by the end of December. So, for EUR strength to be sustained, the ECB would need to stay relatively hawkish.
That said, if escalation continues and oil prices stay high, even a hawkish ECB may not be enough to support EUR.
So for now, FX remains a clean way to express views on:
- energy,
- policy divergence,
- risk sentiment.
🥇 Gold
Gold remains sensitive to:
- real rates,
- inflation expectations, especially due to the oil shock,
- liquidity conditions.
If inflation remains elevated and leads to higher rates, gold is likely to stay under pressure.
If real rates remain low or fall, that would be supportive for gold.
So for now, gold is behaving more like a risk-sensitive macro asset than a pure geopolitical hedge.
If you wonder where you can check real rates you can check at FRED. https://fred.stlouisfed.org/series/DFII5
These are tickers for longer dated ones: DFII10 = 10-year U.S. real rate, DFII30 = 30-year U.S. real rate.
Thanks for reading! Feel free to reach out if you have questions!
🦊👑 Macro Insights Queen Team
email: info@macroinsightsqueen.com
The headlines may change quickly, but the macro forces underneath matter far more. That’s what we focus on here — cutting through the noise to identify the real drivers shaping markets.
If you found this useful and haven’t subscribed yet, you can join the newsletter at:
www.macroinsightsqueen.com/subscribe
For more frequent charts, market updates, and macro breakdowns throughout the week, follow us on Instagram:
@macroinsightsqueen