
WEEKLY | May 26, 2026 | Macro Insights Queen
Hi everyone — last edition we took a cautious view on the relief rally, arguing that ceasefire headlines didn’t fundamentally change the oil shock regime and that markets were too optimistic on fading energy risk. That said, we also flagged that the AI rally made sense — P/E had already retraced during the Iran conflict, while forward earnings were running bullish.
Over the past month, equities led by the Nasdaq have continued printing new highs, the dollar is still bid, and hot CPI and PPI prints alongside rising rates have done nothing to slow any of it down. The price action is telling us something important, and we want to update our read.
📌 Updated Thesis
There is currently no consensus regarding the macro cycle we are in. Our observation is that market participants’ views are split between these two perspectives:
- AI capex is driving growth while consumption remains resilient despite the supply shock.
- The oil shock is going to weaken consumption, meaning the economy faces a greater risk of stagflation rather than reflation.
Nevertheless, the market is telling us something important:
Despite hotter CPI, higher nominal yields, a stronger dollar, and elevated geopolitical risk, equities — especially AI-linked names — continue making new highs.
That changes the framework.
Our Updated View:
AI Capex & Earnings Boom > Energy Cost Shock
As long as AI-driven earnings growth continues to outpace the drag from higher energy costs and tighter financial conditions, dips remain buying opportunities.
This regime behaves more like a mid-cycle reacceleration / reflationary environment rather than a late-cycle slowdown. Markets are increasingly pricing:
- structurally higher nominal growth,
- rising AI capex,
- resilient asset markets.
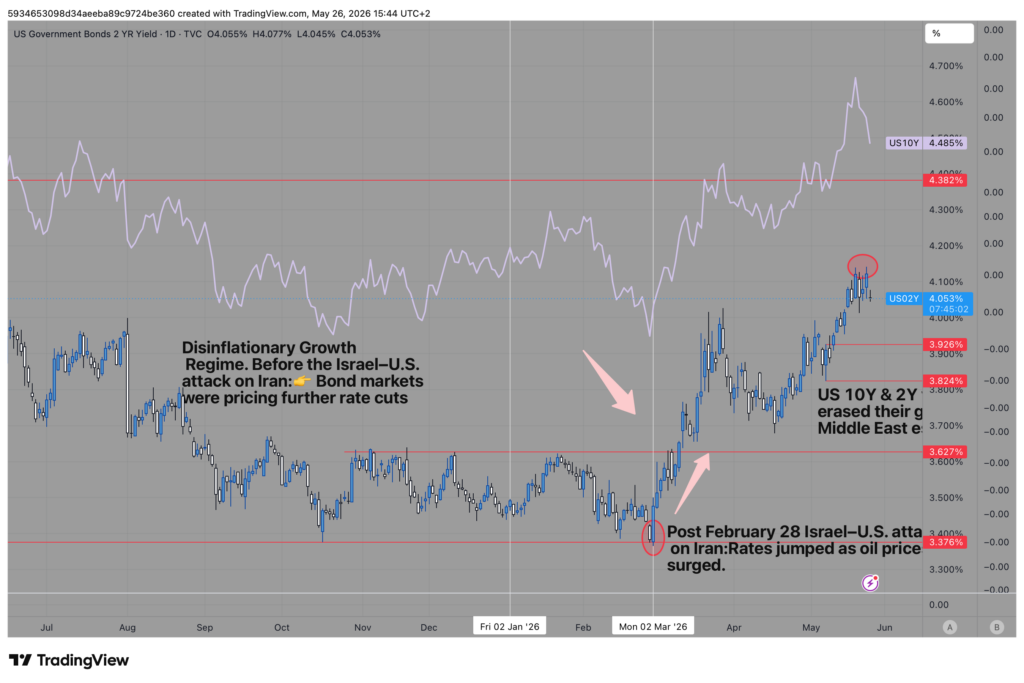
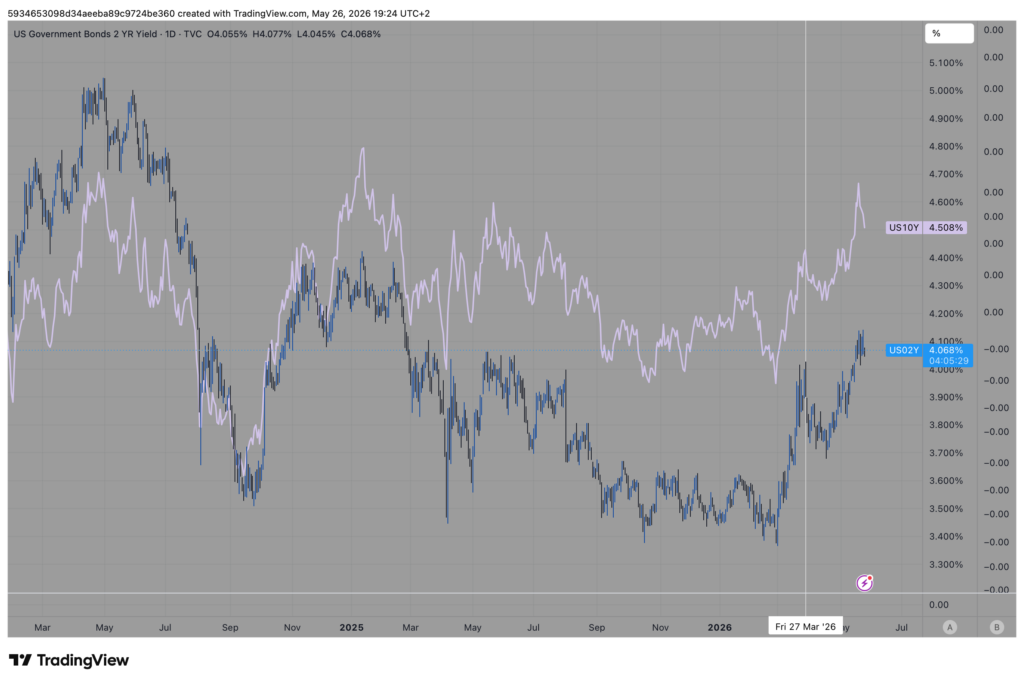
Rate hikes are already being priced into the short end of the curve. The US 2Y yield closed at 4.123% on Friday, May 22nd, 2026 (see chart 1).
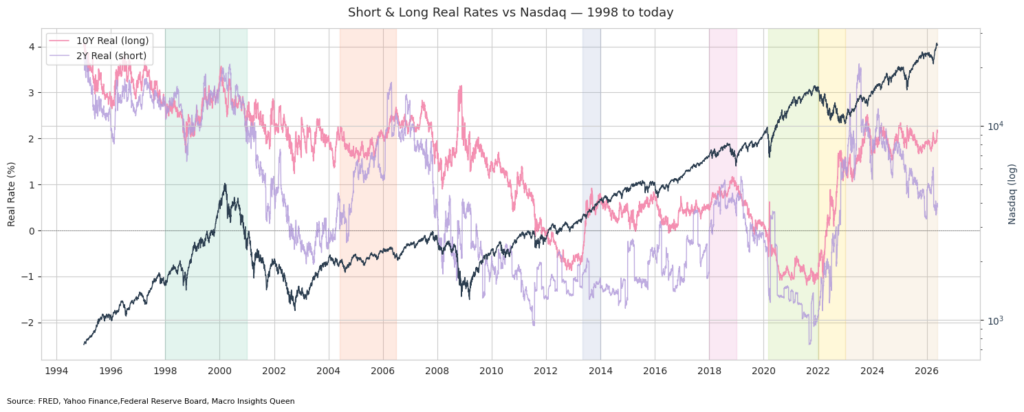
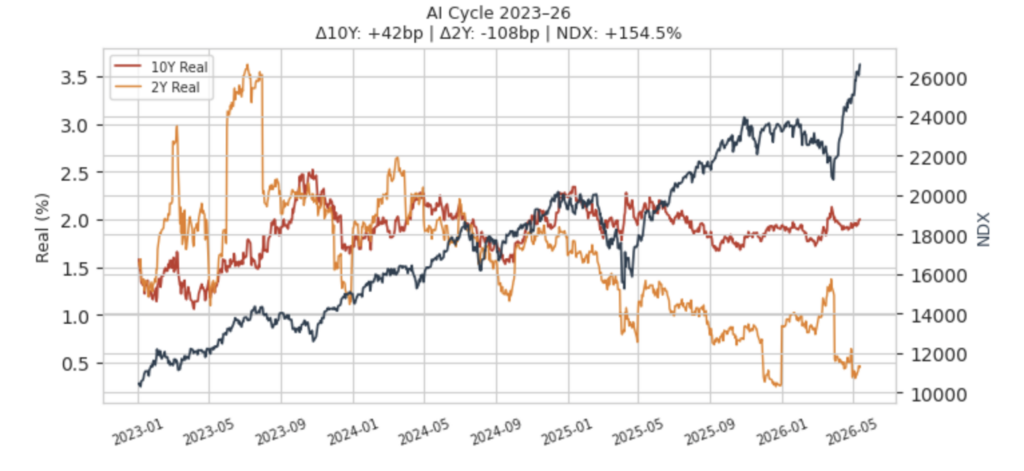
Yet, the Fed still does not appear restrictive enough to break the cycle. Short-term real rates remain historically low. The short real rates are currently around the pre-covid level (see chart 2, the pink shaded area and that’s exactly where real rates are now). Real rates, the short ones, have gone down significantly during the 2023-2026 AI cycle (see chart 3).
🗓 What Mattered This Month
AI-led rally continued
The Nasdaq pushed to new highs even as:
- nominal yields broke above March peaks,
- CPI reaccelerated,
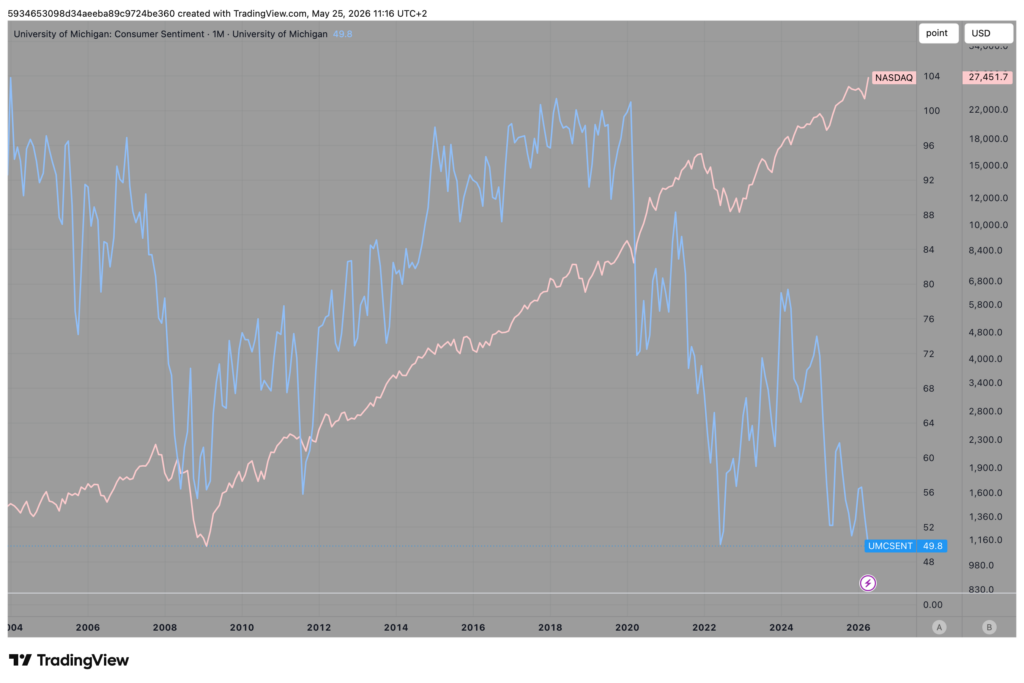
- and retail sales softened while consumer sentiment slumped (see chart 4).
Markets are prioritizing earnings growth over inflation or recession fears.
From both price action and forward earnings data, it appears that recession risk is still not being priced in meaningfully despite the mixed consumption data (which will be explained further in the next section).
Inflation reaccelerated
- Headline CPI: 3.8% YoY (highest since May 2023)
- Core CPI: 2.8% YoY
A year ago, this type of inflation print would likely have triggered a major equity selloff. This time, markets barely reacted.
That tells us the market still believes:
- growth and earnings can absorb higher inflation,
- and nominal growth remains resilient.
As a result, markets are not yet overly concerned about additional hikes, which is reflected in equities making all-time highs alongside higher short-end nominal rates.
Consumer slowing — but not breaking
Retail sales decelerated sharply from the prior month, confirming that higher rates are weighing on consumption.
Consumer sentiment also remains at record lows. In fact, it is lower than the 2022 recession-fear lows (see chart).
However:
- labor markets remain relatively stable,
- wage growth is still positive and sticky,
- and upper-income consumption continues to be supported by rising asset prices.
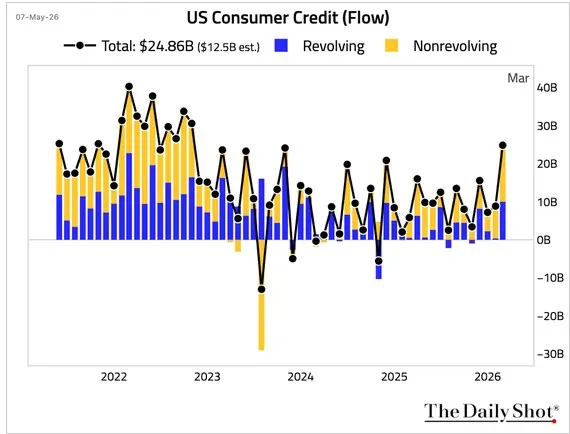
Consumer credit growth has also picked up again, implying that the inflation shock may no longer be purely a supply-side story, but increasingly a demand-side story as well, as highlighted by Danny Dayan (see chart 5).
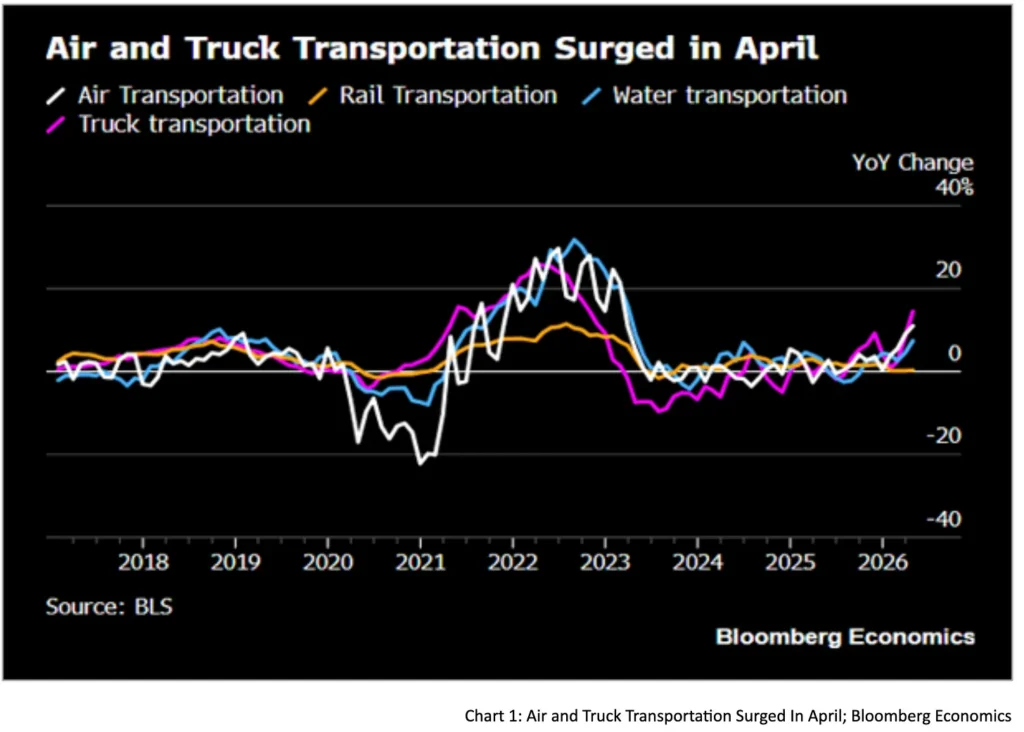
Meanwhile, air and truck transportation activity continues making higher highs, as shared by The Weekly Wintersberger (see chart 6).
⚠️ What Macro Regime Are We In?
This increasingly does not look like the traditional disinflationary slowdown the consensus positioned for at the start of the year.
Markets are pricing a structurally different regime:
- stronger nominal GDP growth,
- accelerating AI-driven capex,
- persistent fiscal impulse,
- and elevated capital spending financed largely through debt issuance.
That regime shift helps explain the unusual coexistence of:
- equities grinding higher,
- nominal yields repricing higher across the curve,
- and a resilient U.S. dollar.
Historically, these moves rarely coexist unless markets believe growth is being supported by:
- rising productivity,
- stronger nominal earnings growth,
- and durable investment and consumer demand.
But inflation remains part of the story. This is not a clean Goldilocks productivity boom.
The economy may be entering a regime where:
- productivity improves,
- investment accelerates,
- demand stays firm,
- yet inflation runs structurally stickier than in the pre-COVID era.
Why? Because many of the same forces driving growth are also inflationary:
- massive AI infrastructure spending,
- loose financial conditions, as real rates remain historically low despite higher nominal yields,
- persistent fiscal deficits,
- industrial policy,
- and still-tight labor markets.
📈 Understanding the Real Rates and the Yield Curve
The most important macro signal right now is happening within rates markets.
What we’re seeing
- 2-year nominal yields made new highs as of last Friday, though they retraced after Trump claimed negotiations with Iran were nearing a resolution (see chart 7).
- Long-end nominal yields also moved above the March conflict peaks. However, they have retraced slightly since Friday and are currently trading around those levels (see chart 7).
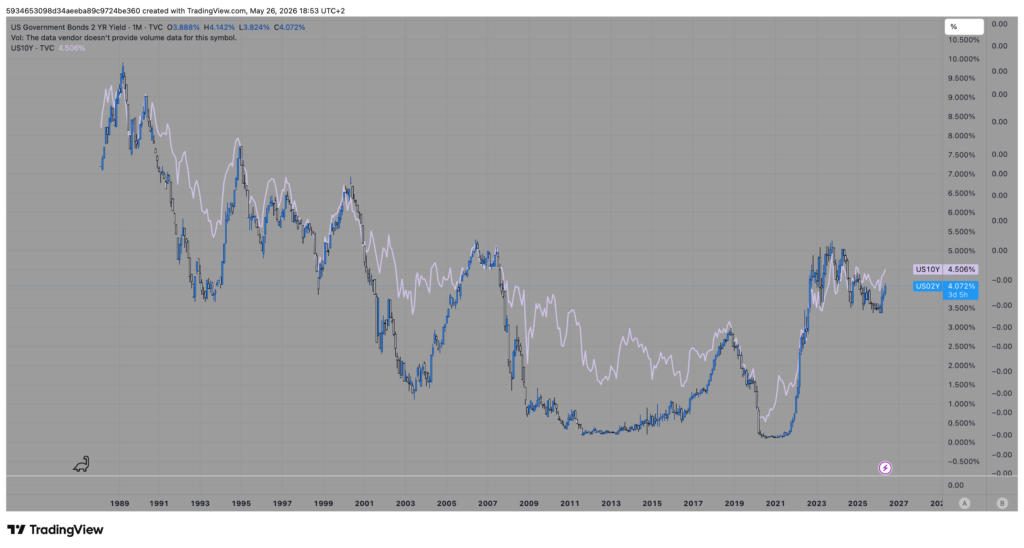
- When we look at historical nominal rates, it looks like higher than the pre-covid level(see chart 8).
- Yet, short-end real rates remain relatively low compared to historical levels during AI cycle (see chart 9), suggesting financial conditions are still relatively loose. And the short real rate isn’t higher than the pre-covid level(see chart 2 previous)
- Long-end real rates are pushing higher, but not yet high enough to materially pressure equities (see chart 2 & 3).
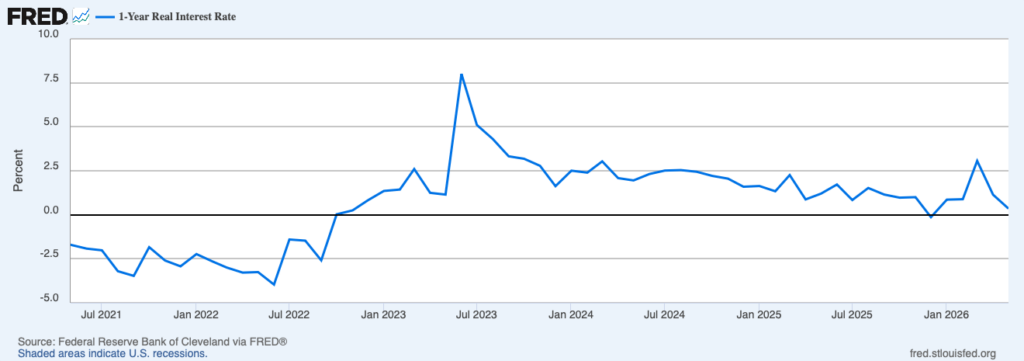
This suggests markets are pricing:
- Rising inflation expectations in the near term.
- Stronger long-term nominal growth.
- Higher AI capex investment expectations financed through debt issuance, leading to higher nominal rates.
- Expanding term premium and fiscal issuance pressure.
In simple terms:
Markets believe the economy can continue running hotter for longer because rates are still not restrictive enough in real terms.
🤖 The Market’s Core Question Besides Rates and Monetary Policy
Can AI capex continue making new highs — and can AI revenue scale fast enough to justify it?
That sits at the center of the current equity rally.
AI infrastructure spending expectations for 2026 are already approaching $600–800bn, with some estimates projecting a path toward $1tn+ by 2027.
The key question now becomes:
Can AI monetization scale fast enough to justify the investment cycle before tighter financial conditions eventually slow the economy?
As long as earnings expectations continue rising faster than rates, the broader AI trade likely remains intact.
📊 Key Metrics To Watch
1. Hyperscaler AI Revenue vs Capex
This remains one of the cleanest measures of whether AI spending is actually being monetized.
Watch:
- Microsoft
- Amazon
- Alphabet
- Meta
If AI-related revenue growth continues to accelerate alongside CapEx, markets will likely continue rewarding the AI trade.
In the previous earnings season, Meta sold off despite beating earnings expectations, as investors questioned whether its rapidly rising AI CapEx was translating into clearly measurable AI-driven revenue growth and monetization.
2. Infrastructure Demand
One of the best leading indicators remains:
Vertiv Holdings Book-to-Bill
Why it matters
Power and cooling infrastructure is typically ordered well before GPU deployment.
Current:
- Book-to-bill near 2.9x
Framework:
- Above 1.5x → cycle remains strong
- Below 1.0x for multiple quarters → early warning signal
3. GPU Supply and Demand
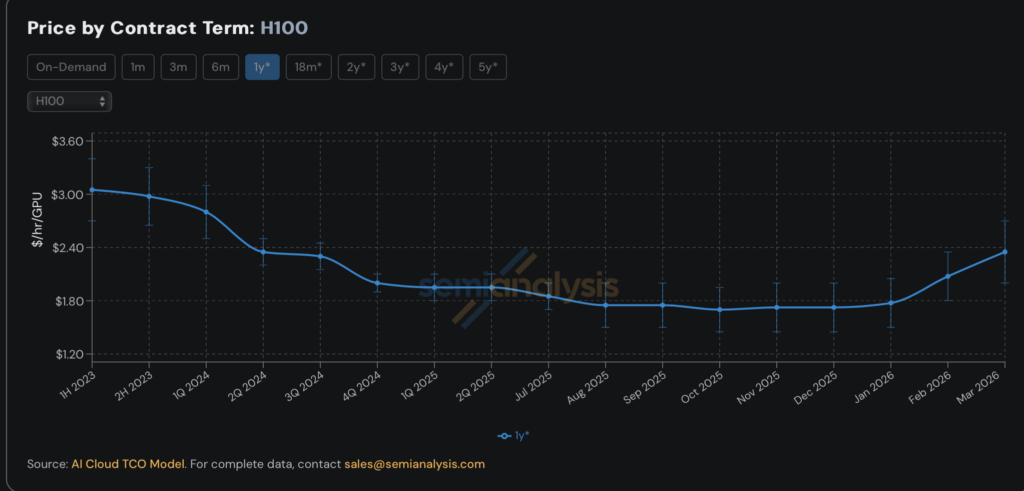
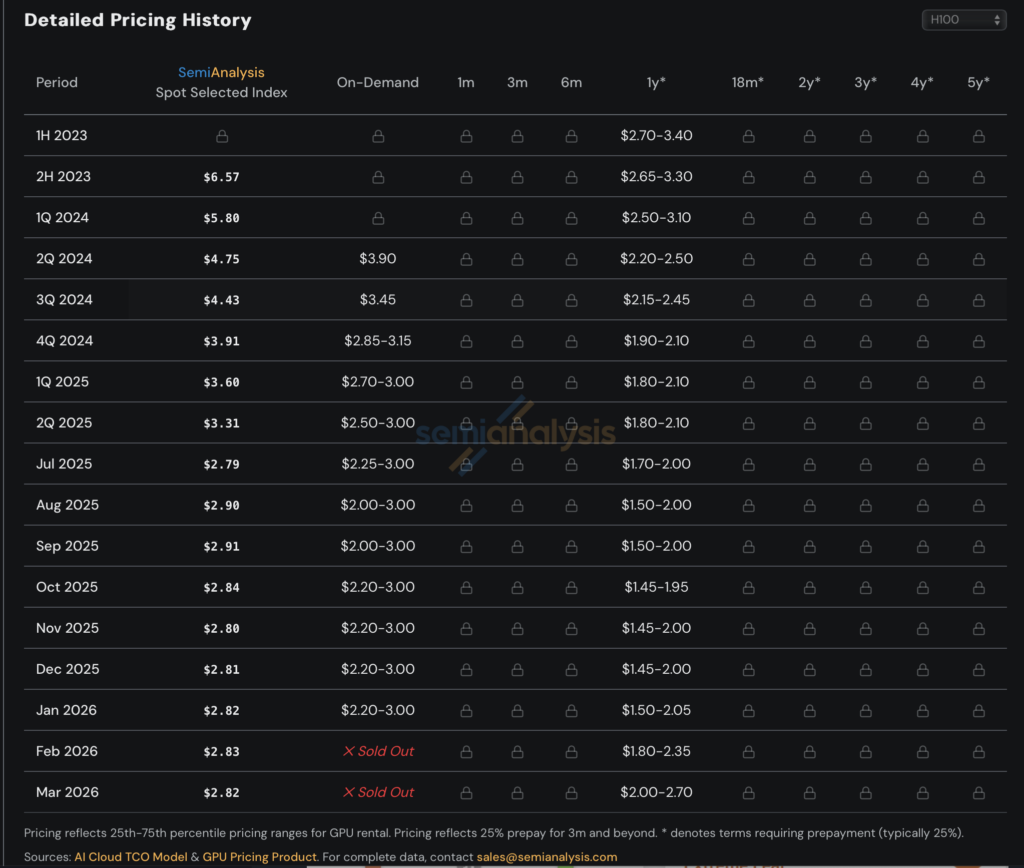
GPU rental pricing trend will be a good proxy to show how tight the GPU supply is vs. demand. Increasing rental prices when on-demand availability drops show that the supply is tight. This is going to lead market prices. This tight supply and increasing rental prices mean more bullish equity on the back of AI catalyst.
GPU rental pricing is one of the cleanest proxies for how tight GPU supply is versus demand, and it tends to lead equity price action.
When on-demand availability drops and rental prices rise, it tells you supply isn’t keeping up with demand (see charts). That’s a real time signal that AI compute demand is still accelerating faster than NVIDIA and the hyperscalers can deploy, which is structurally bullish for AI linked equities. It confirms the capex cycle has runway, and that hyperscaler revenue is being constrained by supply rather than demand.
Also do check on-demand availability of GPU by 3fourteen Research which confirms further the tightness of GPU supply,
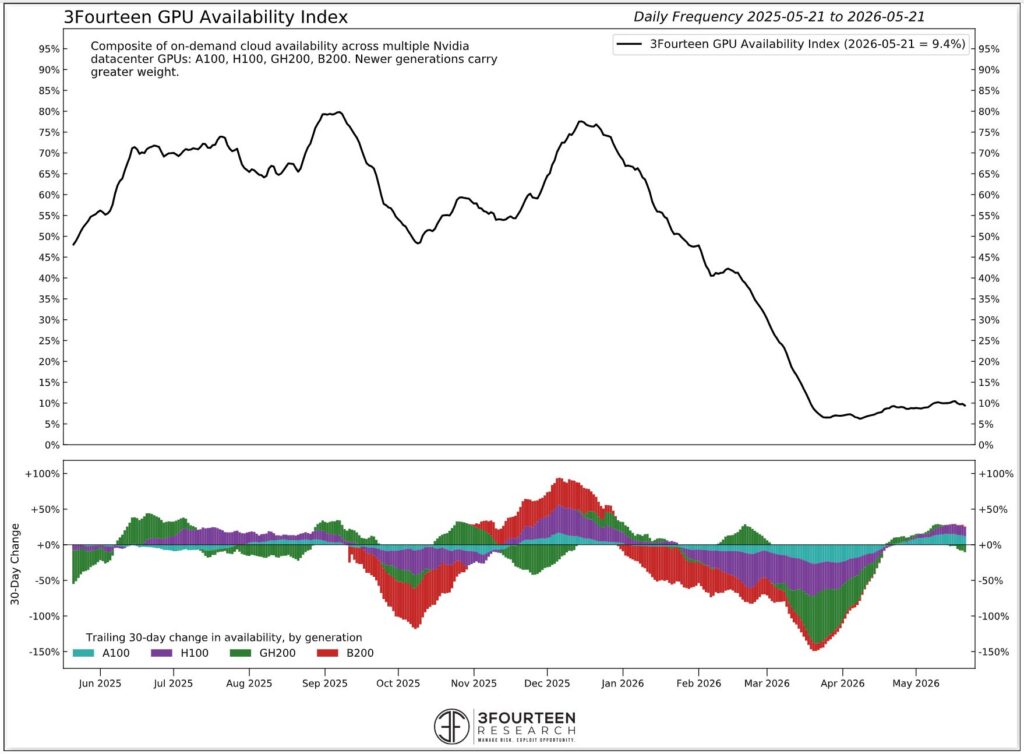
Worth watching closely. This metric tends to move before earnings prints, and well before sell side estimates catch up.
You can track the rental pricing data here: https://semianalysis.com/gpu-pricing-index/
📉 Why Higher Rates Haven’t Broken Equities Yet
Higher rates alone do not necessarily kill a productivity boom.
The late-1990s tech cycle remains the closest historical comparison(see chart):
- the Nasdaq continued rallying through most of the Fed hiking cycle.
- and only peaked after 125 bps hikes and once earnings expectations finally broke.
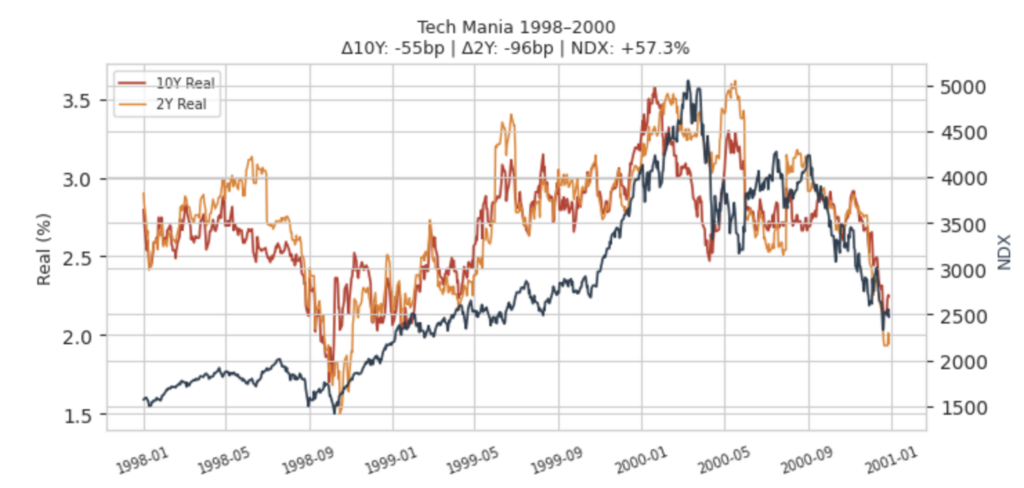
That distinction matters.
Right now:
- nominal yields are rising,
- but financial conditions still do not appear restrictive enough,
- as real rates remain relatively low historically and short-end real rates have declined instead.
Therefore, financial conditions remain relatively loose, and the rise in nominal rates so far has not meaningfully damaged AI and broader sectors earnings expectations.
That is why dips continue getting bought.
🔎 What Would Change This View?
Most risks currently being discussed are not yet regime-breakers:
- higher CPI,
- softer consumption,
- or moderate oil strength.
However, certain consumer-driven sectors could be impacted meaningfully if geopolitical tensions in the Middle East re-escalate.
This could potentially push oil prices above $118/barrel.
But the real threat remains:
An aggressive Fed tightening cycle strong enough to overwhelm AI earnings growth expectations.
That is the key macro risk.
If the Fed hikes only another 50bps – 75bps, markets would likely remain relatively stable. Beyond that, we would expect more meaningful drawdowns in equities.
Until then, the current environment still favors:
- AI infrastructure,
- semiconductors,
- productivity-linked equities,
- and selective risk exposure.
The USD should also remain supported by favorable rate differentials and higher long-end yields.
💼 Trade View
| Asset | View |
|---|---|
| Nasdaq / AI | Buy dips |
| Oil | Structurally supported |
| USD | Supported by rate differentials |
| Long-duration bonds | Still cautious |
| Consumer-sensitive equities | Likely to underperform AI-linked sectors |
🌐 Cross-Asset Framework
Equities
Constructive overall, especially AI-linked sectors.
Oil
Still carrying geopolitical and inflation premium, but no longer the dominant macro driver.
USD
Supported by relative growth and rate differentials.
Gold
More sensitive to rising real or even nominal yields than geopolitics at the moment.
Bonds
Long-end yields can continue repricing higher if nominal growth expectations remain strong.
Bottom Line
The market is increasingly pricing a world of:
- stronger nominal GDP growth,
- accelerating AI capex,
- persistent fiscal impulse and still-loose financial conditions,
- and elevated capital spending financed largely through debt issuance.
The consumer is softening at the lower end, but there are growing signs that aggregate demand is reaccelerating. Upper-income households continue to benefit from the wealth effect as asset prices rise, and consumer credit growth has started to pick up again. Combined with the AI complex and policy-driven sectors, this is keeping aggregate earnings well supported.
For now, AI capex and earnings growth continue to outpace the energy shock. Until the Fed becomes restrictive enough to break that earnings cycle, which we’d put at roughly another 50 to 75bps of hikes, dips remain buying opportunities.
Leave a Reply